
How to read your LinkedIn analytics (2026 guide)
November 3, 2026
TL;DR
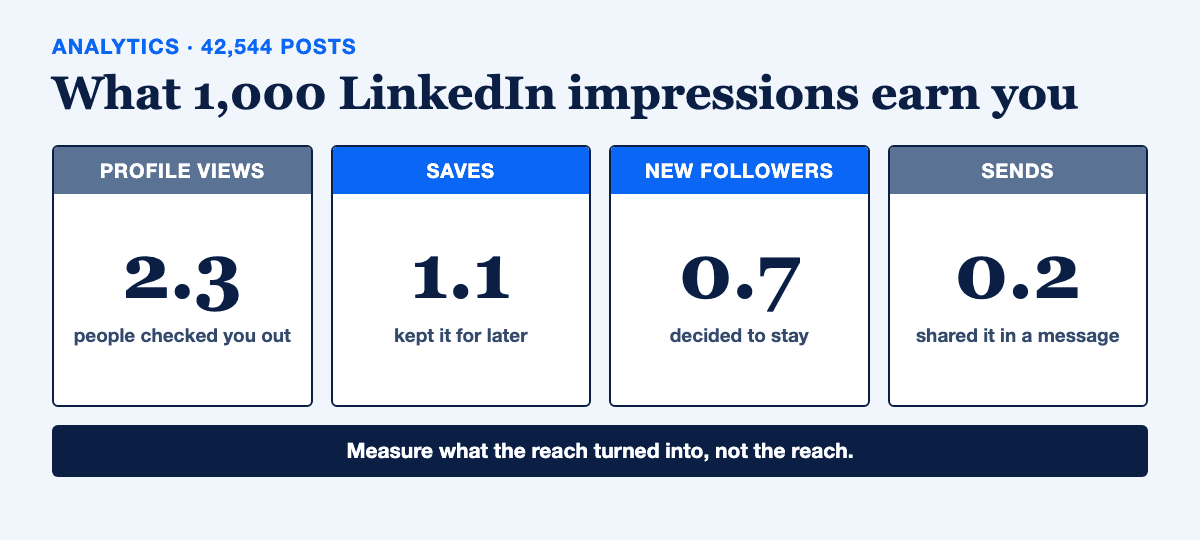
To read your LinkedIn analytics, judge each post by what its reach turned into, not by the reach itself. Sort by followers gained and saves, check whether new people saw it, and repeat what worked. Across 42,544 posts from accounts connected to 2pr.io, 1,000 impressions earned about 2.3 profile views, 1.1 saves, 0.7 new followers and 0.2 sends. The top 10% of posts brought in 81% of all new followers.
To read your LinkedIn analytics, stop asking how many people saw a post and start asking what that reach turned into: profile views, saves, sends and new followers. Impressions tell you a post was shown. The other numbers tell you whether it did anything.
This matters more this week, because LinkedIn just put all of these numbers in one place. Its announcement of the new Dashboard tab and Post Performance Table means you no longer have to open posts one by one.
More data only helps if you know what you are looking at. So here is what each number means, what normal looks like, and how I would use it. The benchmarks come from 42,544 posts by 2,148 accounts connected to 2pr.io, published in the last three months, with at least 100 impressions each. Treat that as a signal, not a study. These are people who post on purpose, not a random slice of LinkedIn.
What changed in LinkedIn analytics
Four things are worth knowing:
- Post Performance Table. All your posts and their metrics in one view, with an export. It is rolling out on desktop first, with mobile to follow.
- Who followed you. You could already see how many people followed you from a post. Now you can click through and see which profiles they were.
- Saves and sends. How many people bookmarked a post, and how many shared it in a LinkedIn message.
- In-network and out-of-network reach. The percentage of your impressions that came from people who already follow or are connected to you, versus people who do not.
To open the table, go to Content Analytics on desktop, choose Post Impressions, find Most Recent Post Performance, and pick "Show all posts". If you do not see it yet, you are probably still waiting on the rollout.
What each LinkedIn metric actually tells you
Swipe sideways to compare
| Metric | What it measures | The question it answers |
|---|---|---|
| Impressions | Times the post was shown, repeats included | Did LinkedIn give it a chance? |
| Members reached | Unique people who saw it | How many different people was that? |
| Profile views | Visits to your profile from the post | Did anyone want to know who wrote it? |
| Saves | Bookmarks | Was it worth coming back to? |
| Sends | Shares in a LinkedIn message | Did someone think of a specific person? |
| Followers gained | New followers from the post | Did anyone want more of you? |
| In and out of network | Share of impressions from people who know you vs. people who do not | Did it travel past your circle? |
Reactions and comments still count, but they are the numbers everyone can see, so they get too much attention. I wrote about that trap in why saves beat likes and in likes vs. impressions.
What normal looks like
Here is what the 42,544 posts earned per 1,000 impressions:
Swipe sideways to compare
| Outcome | Per 1,000 impressions | Posts with at least one |
|---|---|---|
| Profile views | 2.3 | 82% |
| Saves | 1.1 | 46% |
| New followers | 0.7 | 47% |
| Sends | 0.2 | 19% |
Three honest notes. The per-1,000 figures are totals across all posts, so large accounts weigh more than small ones. Sends and profile views were recorded on about 26,800 of these posts, not all of them. And the median post in this sample got 986 impressions, but it excludes posts under 100 impressions, so your own median may sit lower. For a fuller picture of reach, see our LinkedIn benchmark.
The useful takeaway is that a quiet post is normal. More than half of posts earn no saves, and more than half earn no new followers. Do not read one quiet post as a problem. Read the pattern across 20 or 30 of them.
Your most-viewed posts are not always your best posts
Two findings changed how I read the table.
Followers are even more concentrated than reach. The top 10% of posts brought in 81% of all new followers. So the job is not to get a little more from every post. It is to find what your few winners have in common. This is the same pattern as Super Pareto, and it applies to growth as much as to reach.
A top-reach list misses a lot of winners. I compared the top 10% of posts by impressions with the top 10% by followers gained. Only 64% appeared on both lists. The other 36% of the best follower-winning posts did not make the top 10% for reach, so you would never spot them by sorting on impressions.
Saves also tracked followers more closely than impressions did (a correlation of 0.76 vs. 0.56). That is a correlation, not a cause, and bigger posts tend to have more of everything. But it fits what most people see: a post worth keeping often makes someone want the next one too.
How to read your LinkedIn analytics in 15 minutes
Do this once a month. You need the table and nothing else.
- Take the last 20 to 30 posts. Fewer than that is mostly noise.
- Sort by followers gained. Note the top five. These are the posts that grew your audience.
- Sort by saves. Note the top five again. These are the posts people found useful.
- Compare both lists with your top posts by impressions. The posts on the first two lists but not the third are your hidden winners.
- Write down what the winners share. Topic, format, hook and the promise of the post. Be specific: "teardown of a real pricing page" beats "educational content".
- Check who followed. Open followers gained on your top posts. Are these the people you want, or just people in your industry who like the topic?
- Check out-of-network reach. A high share with few followers suggests strangers saw you and did not care to stay. Look at your first lines and your profile. A low share on a good post suggests it worked on your audience but did not travel.
- Plan your next five posts from step 5. If this step does not happen, the rest was a waste of 15 minutes.
Step 8 is where most analytics reviews die. The table shows you what worked. It does not write the next post for you.
What third-party tools can and cannot see
LinkedIn says its Member Post Analytics API brings these numbers into third-party tools, but not everything in the app is there. LinkedIn's API documentation currently lists impressions, members reached, reshares, reactions, comments, saves, sends, link clicks, premium button clicks, followers gained and profile views.
It does not list the in-network split, or the names of the people who followed you. So for those two, use LinkedIn's own Dashboard, whichever tool you pay for.
That is also the fair way to judge an analytics tool now. If it only shows you a table, LinkedIn gives you that for free. It has to do something with the numbers.
2pr.io shows saves, sends, profile views and followers gained for each post in its analytics, so you can sort your posts the way step 2 describes. Then it drafts in your own voice, learned from your persona and AI interviews, and pulls ideas from a library of high-performing posts. Plans start at $24/month for individuals on annual billing (or $49 month to month), and you can see the details on the pricing page.
FAQ
Where do I find the new LinkedIn analytics?
In the Dashboard tab and in Content Analytics on desktop. The Post Performance Table sits under Post Impressions, then Most Recent Post Performance, then "Show all posts". LinkedIn is rolling it out in stages, so it may not be on your account yet.
What is a good number of saves on LinkedIn?
Across our sample, about 1 save per 1,000 impressions, and 46% of posts got at least one. Beat your own median rather than someone else's number, because topic and audience change it a lot.
What is the difference between impressions and members reached?
Impressions count every time a post was shown, including repeat views by the same person. Members reached counts each person once, so it is always the same or lower.
Is in-network or out-of-network reach better?
Neither on its own. Out-of-network reach is how new people find you, while in-network reach keeps the audience you have. What matters is whether the strangers who see a post follow you, so read it next to followers gained.
The bottom line
LinkedIn just made the numbers free and easy to find. That makes reading them correctly the only real edge left. Sort by what the reach turned into, look for the small group of posts doing the work, and turn what you find into your next five posts. Do that every month and the table pays for itself in followers, not just charts.
More LinkedIn guides
21 students, 5 paying customers: why a small trusted group beats a big audience
A real affiliate case study. Joachim Lépine trains professional translators to get clients on LinkedIn. He recommended 2pr.io to a beta group of 21 people, and 5 became paying customers, most on annual plans. That is roughly 1 in 4, and $350 in commission in seven weeks, from a group smaller than most LinkedIn posts' comment sections.
October 2, 2026How to get more impressions on LinkedIn: 12 lessons
How to get more impressions on LinkedIn, from 2M impressions in a year: chase breakout posts, win the hook, pick a lane, and measure every post.
September 18, 2026LinkedIn's Network tab: what the feed split means
LinkedIn split the feed into For You and Network tabs. Here is what the change does, why it happened, and what it means for creators.
Grow on LinkedIn with 2pr
Ideas, AI drafts in your voice, carousels, scheduling, and analytics: one tool. Start your free trial.
Start free trial